Using perf-probe To Analyse VM Exits
perf-probe provides a way for you instrument the Linux kernel at
runtime with your very own dynamic tracepoint – you can create a
tracepoint for any function or source line in the kernel. While the
kernel does provide a whole bunch of tracepoints out of the box (I
count 1126 on this Haswell machine), they don’t cover everything.
Sometimes you need to roll your own.
Like recently, when I was looking at the following kvm_stat -d
output while comparing the performance of the same workload on bare
metal and in KVM:
kvm statistics - summary

 Event                                        Total Current
 exits                                    705683003    4037
 irq_exits                                443033416    1590
 host_state_reload                         41607894     140
 fpu_reload                                41607606     140
 io_exits                                  15393558      40
 insn_emulation                            30019356       0
 halt_exits                                  204769       0
 halt_attempted_poll                         116527       0
 halt_wakeup                                  89923       0
 halt_successful_poll                         69359       0
 pf_fixed                                     27294       0
 largepages                                   25592       0
 tlb_flush                                      315       0
 mmu_cache_miss                                 213       0
 mmu_shadow_zapped                              186       0
 hypercalls                                     144       0
 signal_exits                                   143       0
 irq_injections                                 116       0
 pf_guest                                        96       0
 irq_window                                      46       0
 mmio_exits                                      14       0
 remote_tlb_flush                                 2       0
All of these events incur a VM exit which is costly. Hundreds of cycles costly.
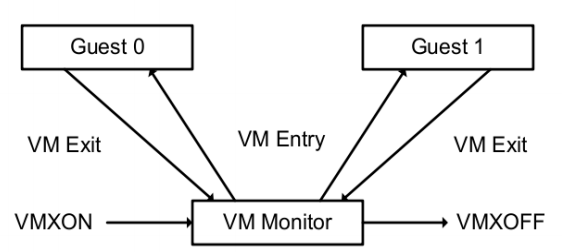
Worse, if you’re comparing against bare metal like I was, it’s overhead that simply doesn’t exist in the baseline because there is no need to transfer control to the VM monitor. The following diagram from the Intel Architecture Software Developer’s Manual (SDM) Vol. 3C illustrates the transition from guests to host.
Any chance to eliminate VM exits can potentially be a major performance win.
With that in mind, I paused when I read the io_exits event in the
list above, having no idea what an io_exit event was. Reading the
kernel source showed that the event happens in response to the KVM
guest executing an I/O instruction (inb, outb, etc), at which
point I’m thinking, “Why on earth is KVM
executing I/O instructions? That’s gotta be emulation for some legacy
peripheral”.
The problem was: I didn’t immediately know how to verify that.
The kvm:kvm_exit tracepoint gives the address of the I/O
instruction that caused the VM exit, so it’s possible to find all
instruction addresses, sorted by number of occurrences by doing:
$ bash -c 'perf record -e kvm:kvm_exit -a -- sleep 1' ; perf script | \
>  grep "reason IO_INSTRUCTION" | awk '{print $10}' | sort | uniq -c |
>  sort -rn
[ perf record: Woken up 18 times to write data ]
[ perf record: Captured and wrote 10.396 MB perf.data (102628 samples) ]
   1952 0xffffffff813267ea
      4 0xffffffffa01a4919
      2 0xffffffff81326705
Looking up the function in the guest kernel with addr2line -e vmlinux
-f 0xffffffff813267ea revealed that the iowrite16 function was the
cause of 99.7% of the io_exits events.
And this is where perf-probe comes into its own. From within the
guest, I can create my own dynamic tracepoint on iowrite16() and
gather a cpu-cycles profile with callstack to show which code paths
lead to it.
$ perf probe --add iowrite16
Added new event:
  probe:iowrite16      (on iowrite16)

You can now use it in all perf tools, such as:

        perf record -e probe:iowrite16 -aR sleep 1

$ perf record -e probe:iowrite16 -a -g -- sleep 1
[ perf record: Woken up 1 times to write data ]
[ perf record: Captured and wrote 0.156 MB perf.data ]
$ perf report --no-children -F overhead,sym --stdio

# To display the perf.data header info, please use --header/--header-only options.
#
#
# Total Lost Samples: 0
#
# Samples: 18  of event 'probe:iowrite16'
# Event count (approx.): 18
#
# Overhead  Symbol
# ........  .............
#
   100.00%  [k] iowrite16
            |
            ---iowrite16
               vp_notify
               |
               |--96.67%-- virtqueue_notify
               |          virtio_queue_rq
               |          __blk_mq_run_hw_queue
               |          blk_mq_run_hw_queue
               |
                --3.33%-- virtqueue_kick
                          virtio_read
                          hwrng_fillfn
                          kthread
There you have it, the cause of the majority of the io_exits are the
virtio_blk
and
virtio-rng
drivers. Who knew?