Comparing perf.data files with perf-diff
Being a performance engineer (or an engineer who’s mainly concerned with software performance) is a lot like being any other kind of software engineer, both in terms of skill set and the methods you use to do your work.
However, there’s one area that I think is sufficiently different to trip up a lot of good engineers that haven’t spent much time investigating performance problems: analysing performance data.
The way most people get this wrong is by analysing numbers manually instead of using statistical methods to compare them. I’ve written before about how humans are bad at objectively comparing numbers because they see patterns in data where none exist.
I watched two talks recently (thanks for the recommendation Franklin!) that riffed on this theme of “don’t compare results by hand”. Emery Berger spends a good chunk of his talk, “Performance matters” explaining why it’s bad idea to use “eyeball statistics” (note eyeball statistics is not actually a thing) to analyse numbers, and Alex Kehlenbeck’s talk “Performance is a shape, not a number” really goes into detail on how you should be using statistical methods to compare latencies in your app. Here’s my favourite quote from his talk (around the 19:21 mark):
The ops person that’s responding to a page at two in the morning really has no idea how to compare these things. You’ve gotta let a machine do it.
And here’s the accompanying slide that shows some methods you can use.

"Did behavior change?" slide from Alex Kehlenbeck's talk
Yet despite knowing these things I stil have a bad habit of eyeballing
perf.data files when comparing profiles from multiple runs. And as we’ve
established now, that’s extremely dumb and error prone. What I really should be
doing is using perf-diff.
Here’s a gist for random-syscall.c,
a small program that runs for some duration in seconds and randomly calls
nanosleep(2) or spins in userspace for 3 milliseconds. To generate some
profile data, I ran it 5 times and recorded a profile with perf-record like
this:
$ gcc -Wall random-syscall.c -o random-syscall
$ for i in $(seq 1 5); do sudo perf record -o perf.data.$i -g ./random-syscall 10; done
Executing for 10 secs
Loop count: 253404
[ perf record: Woken up 14 times to write data ]
[ perf record: Captured and wrote 3.577 MB perf.data.1 (31446 samples) ]
Executing for 10 secs
Loop count: 248593
[ perf record: Woken up 12 times to write data ]
[ perf record: Captured and wrote 3.185 MB perf.data.2 (28252 samples) ]
Executing for 10 secs
Loop count: 271920
[ perf record: Woken up 12 times to write data ]
[ perf record: Captured and wrote 3.573 MB perf.data.3 (31587 samples) ]
Executing for 10 secs
Loop count: 263291
[ perf record: Woken up 13 times to write data ]
[ perf record: Captured and wrote 3.641 MB perf.data.4 (32152 samples) ]
Executing for 10 secs
Loop count: 259927
[ perf record: Woken up 13 times to write data ]
[ perf record: Captured and wrote 3.507 MB perf.data.5 (30898 samples) ]
$ perf diff perf.data.[1-5]
The output of $ perf-diff perf.data.[1-5] looks like this:
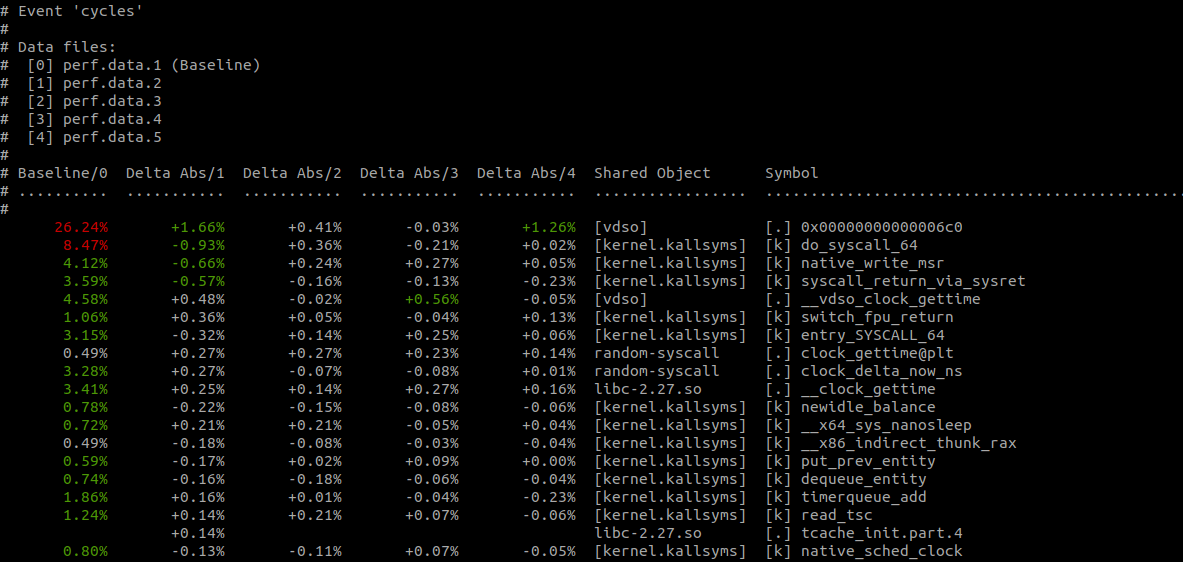
$ perf diff perf.data.[1-5]
Much better! No more eyeball statistics. As you’d expect, perf-diff
comes with the usual assortment of command-line options including
--comms (narrow the displayed results to specific programs), --sort
(order the displayed results by a given key), and --symbols (only
display provided symbols).